Server cloud per SaaS: dimensionare CPU, RAM, NVMe e backup
Per dimensionare un server cloud per un'applicazione SaaS, non partire dal numero di utenti. Parti dalla memoria di ogni processo, poi dalla CPU di ogni container, quindi dal disco per dati, WAL e backup, e verifica ogni ipotesi con un test di carico. Questa guida lo fa su un esempio reale: API e worker Node.js, PostgreSQL, Redis e nginx in Docker Compose, provati su una sola macchina. I profili qui sotto sono ipotesi di partenza; per intervalli iniziali semplici vedi la guida al dimensionamento.
Lo stack dell'esempio
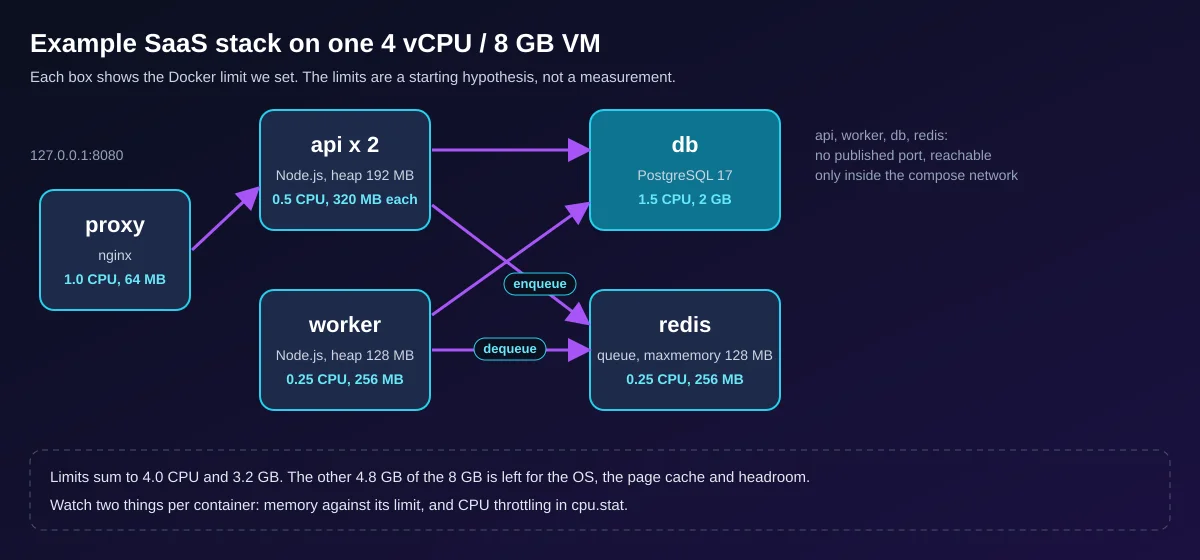
L'esempio è un'API per la gestione di attività: un proxy nginx, due repliche dell'API Node.js, un worker che svuota una coda Redis, PostgreSQL 17 e Redis 7. Solo il proxy pubblica una porta, e solo su loopback. I segreti stanno in un file .env non committato, ogni servizio ha un healthcheck e un limite di risorse, e i log ruotano. Il monitoraggio qui è docker stats, i contatori cgroup e pg_stat_statements. Per il solo lato Node.js vedi Server Cloud per Node.js. I file completi sono in fondo.
Perché gli utenti non si convertono in vCPU
- Concorrenza, non numero di persone - richieste in corso = frequenza di arrivo x tempo per richiesta (legge di Little). 1000 utenti che cliccano una volta al minuto sono circa 17 richieste al secondo; uno script che interroga ogni secondo genera lo stesso carico di 60 di quegli utenti.
- Costo dell'SQL e modello di esecuzione - nella nostra prova la query del report impiegava in media 1,07 ms in
pg_stat_statementse quella dell'elenco 0,07 ms, circa 15 volte meno. Un processo Node.js usa circa un core, quindi le vCPU dell'API corrispondono al numero di processi, non di utenti. - Socket, job e picchi - un WebSocket aperto trattiene memoria per tutta la sua vita, un job in background contende gli stessi core alle richieste, e si dimensiona per l'ora più carica, non per la media.
Tre profili di partenza
Ipotesi, non misure. I prezzi sono importi mensili per Praga, ricalcolati dal listino il 2026-10-14.
| Profilo | Specifica iniziale | Prezzo mensile, base |
|---|---|---|
| Dev / staging | 2 vCPU, 4 GB di RAM, 40 GB NVMe (Small) | EUR 15.00, 1 backup |
| Piccola produzione | 4 vCPU, 8 GB di RAM, 80 GB NVMe (Medium), l'esempio come pubblicato | EUR 18.43, 1 backup |
| SaaS in crescita, un server | 8 vCPU, 16 GB di RAM, 160 GB NVMe (Large) | EUR 36.88, 1 backup |
| SaaS in crescita, separato | server applicativo Medium più un server database da 4 vCPU, 16 GB di RAM, 160 GB NVMe | EUR 18.43 (1 backup) + EUR 39.05 (3 backup) = EUR 57.48 |
L'aritmetica di memoria, disco e backup
I limiti qui sotto sono quelli del file compose; l'ultima colonna è la memoria residente mostrata da docker stats durante i nostri gradini di carico, su tutte le prove.
| Container | Limite | Impostazione | Sotto carico |
|---|---|---|---|
| proxy | 64 MB | nginx, un worker | 3-18 MB |
| api (x2) | 320 MB ciascuno | --max-old-space-size=192, pool da 10 |
21-34 MB ciascuno |
| worker | 256 MB | heap 128 MB, pool da 3 | 19-34 MB |
| db | 2 GB | shared_buffers 512 MB, work_mem 8 MB |
207-252 MB |
| redis | 256 MB | maxmemory 128 MB, senza eviction |
4-7 MB |
I limiti sommano 3,2 GB, quindi 4,8 GB degli 8 GB della VM restano per il sistema operativo e la cache di pagine. Tre regole producono i numeri. Prima, shared_buffers parte dal 25% della memoria di un server database dedicato (documentazione PostgreSQL, verificata il 2026-10-14): il 25% dei 2 GB del container sono 512 MB. Seconda, work_mem vale per ogni operazione di ordinamento o hash, non per connessione, quindi il totale può essere molte volte il valore impostato: 23 connessioni applicative a 8 MB con due operazioni di questo tipo ciascuna danno un caso peggiore di 368 MB. Terza, i pool moltiplicati per i processi (2 x 10 + 3 = 23) devono restare sotto max_connections (50).
Disco e backup. Dopo circa 1,04 milioni di righe il database pesava 146 MB, ma la directory dei dati 457 MB, di cui 288 MB di pg_wal: il WAL segue max_wal_size (un limite morbido), non la dimensione dei dati, quindi calcolalo e lascia libero più del 20% del disco. Su questo dataset minuscolo pg_dump -Fc ha impiegato 0,59 s (7 MB) e il ripristino 1,78 s; il tuo tempo di ripristino è il tuo tempo di fermo, quindi misuralo. Ogni prezzo di DCXV Cloud include un backup settimanale del disco: è una copia di sicurezza, non spazio per i tuoi file.
Trova il collo di bottiglia con k6
Fissa prima la condizione di successo (qui p95 sotto 300 ms e meno dell'1% di richieste fallite), usa un modello aperto (constant-arrival-rate, vedi la documentazione di k6), aumenta la frequenza a gradini e osserva insieme questi segnali.
| Segnale | Comando | Cattivo segno |
|---|---|---|
| p95, errori, iterazioni scartate | riepilogo di k6 | p95 sopra l'obiettivo, il server non regge la frequenza di arrivo |
| Throttling della CPU | grep nr_throttled /sys/fs/cgroup/cpu.stat nel container |
cresce durante il gradino (documentazione del kernel) |
| CPU steal | vmstat 5, colonna st |
sopra 0 su una VM: l'host è conteso |
| Pressione sulla memoria | docker stats, vmstat colonne si so |
vicino al limite, o swap |
Misurato su una macchina Linux arm64 a 12 core con 14,4 GB di RAM, Docker 29.7.2, k6 2.3.0, PostgreSQL 17.11, Node.js 22.23.3, nginx 1.27.5, Redis 7.4.11, il 2026-10-14, una prova da 40 s per gradino salvo dove sono indicati due valori. Non è DCXV Cloud. k6 condivideva le CPU con lo stack e l'host usava anche lo swap, quindi le latenze sono pessimistiche: per un test reale esegui k6 da una seconda macchina. "Scartate" conta gli arrivi che k6 ha saltato perché tutti i 500 utenti virtuali erano occupati.
| Config nginx | Richieste/s offerte | Richieste/s ottenute | p95 | Fallite | Scartate |
|---|---|---|---|---|---|
| A, proxy 0,25 CPU | 1000 | 610 | 2,11 s | 0,03% | 15 595 |
| A, proxy 1,0 CPU | 1000 | 994 e 997 | 150 ms e 51,5 ms | 0% | 207 e 121 |
| A, proxy 1,0 CPU | 2000 | 941 | 1,77 s | 6,56% | 42 356 |
| B, keepalive | 1000 | 999 e 1000 | 2,66 ms e 2,42 ms | 0% | 36 e 0 |
| B, keepalive | 5000 | 4995 | 1,48 ms | 0% | 206 |
| B, keepalive | 8000 | 7918 | 23,1 ms | 0,02% | 2532 |
La lezione è il metodo, non il throughput. La config A usava proxy_pass con una variabile e senza blocco upstream, quindi nginx apriva una nuova connessione TCP verso l'API a ogni richiesta. Il proxy ha raggiunto per primo il limite di CPU (cpu.stat: con 0,25 CPU 1512 dei 2787 periodi in throttling, e con 1,0 CPU restava un tetto vicino a 940 richieste/s) mentre il database usava molto meno della metà del suo limite. La config B, un upstream con keepalive 32, ha tenuto il proxy attorno a un terzo di una CPU a 8000 richieste/s. I limiti successivi sono poi comparsi negli stessi contatori: il database è andato in throttling in 301 dei 2790 periodi, e il worker da 0,25 CPU quasi in ogni periodo, lasciando 46 982 job nella coda (LLEN jobs). Un dataset di 146 MB sta in memoria, quindi nulla di tutto questo ha toccato il disco. Un controllo con fio su un file temporaneo (fio --name=w --filename=fio.tmp --size=256M --rw=write --bs=8k --fdatasync=1 --ioengine=sync --runtime=15 --time_based) ha misurato 700 scritture sincrone al secondo, da circa 1,4 ms; una prova di lettura casuale (fio --name=r --filename=fio.tmp --size=256M --rw=randread --bs=4k --iodepth=32 --ioengine=libaio --direct=1 --runtime=15 --time_based) ha riportato 399 000 IOPS, che è la cache di pagine e non il disco.
Calcola il prezzo del risultato nel configuratore
- Apri la pagina dei server cloud. Non legge i numeri di questo articolo, quindi impostali tu: scegli la riga di piano più vicina al tuo profilo (Small, Medium o Large), poi regola i cursori di CPU (1-96), RAM (1-256 GB) e disco (20-960 GB) sui valori della tua scheda.
- Aggiungi copie di backup, indirizzi IPv4 extra e ore di amministrazione, poi leggi il prezzo mensile completo, non il prezzo "da". L'amministrazione gestita parte da EUR 30 per due ore.
Verificato sul listino il 2026-10-14: Medium con 3 backup costa EUR 21.47, e la stessa CPU con 16 GB di RAM EUR 29.95. È la RAM a spostare di più il prezzo.
Configura un server cloud per la tua app
Quando separare il database o passare al dedicato
- Separa il DB quando richiede più di circa metà della memoria della VM, quando API e DB si contendono la CPU andando in throttling a vicenda o quando vuoi un ritmo di ripristino distinto. Vedi la guida a PostgreSQL.
- Passa al dedicato quando un carico tiene occupato più del 70% di tutte le vCPU al picco, richiede più delle 96 vCPU o dei 256 GB di RAM di un server cloud o esige una latenza del disco prevedibile. Vedi i server dedicati.
Modello di migrazione e rollback
Provalo prima sul nuovo server.
| Passo | Azione | Rollback |
|---|---|---|
| 1 | Ripristina un dump recente sul nuovo server, avvia l'app e sottoponila a un test di carico | elimina il nuovo server |
| 2 | Blocca le scritture, fai il dump finale, ripristina, confronta il numero di righe | riapri le scritture sul vecchio server |
| 3 | Cambia il DNS (TTL abbassato a 300 s con un intero vecchio TTL di anticipo), prova login, ordine, job e posta | rimetti il DNS com'era |
| 4 | Tieni il vecchio server in sola lettura per almeno una settimana | riproduci le nuove scritture sul lato vecchio |
Scheda di dimensionamento
Stampala e compila la colonna di destra con le tue misure.
| Voce | Come ottenerla | Il tuo valore |
|---|---|---|
| Richieste al secondo al picco | analytics o test di carico | |
| p95 obiettivo e tasso di errori | il tuo SLO, ad esempio 300 ms e 1% | |
| Processi API | uno per vCPU | |
| Limite di memoria del container | RSS di picco sotto carico più margine | |
| Connessioni al DB | pool x processi, sotto max_connections |
|
| Memoria libera mantenuta | 20-25% della VM | |
| Disco | dati e crescita + WAL + log + immagini + dump temporaneo, poi 20% libero | |
| Backup | quante copie, tempo di ripristino misurato | |
| Prezzo mensile | totale del configuratore con backup, IPv4, amministrazione e data |
Riproducilo
Servono Docker con Compose, curl, openssl e vmstat; l'immagine di k6 viene scaricata al primo avvio. I file sono quelli che abbiamo eseguito, con queste versioni. I tag postgres:17-alpine, redis:7-alpine e node:22-alpine sono mobili e npm install non ha un lockfile, quindi fissa tag e versioni se ti serve lo stesso risultato.
compose.yaml
# "Small production" starting hypothesis for a 4 vCPU / 8 GB VM: limits sum to 4.0 CPU and 3.2 GB
name: saas-sizing

x-logging: &logging
  driver: json-file
  options: { max-size: 10m, max-file: "3" }   # logs cannot fill the disk

services:
  proxy:
    build: { context: ., dockerfile: Dockerfile.proxy }
    ports: ["127.0.0.1:8080:80"]        # the only published port, loopback only
    depends_on:
      api: { condition: service_healthy }
    healthcheck:
      test: ["CMD", "wget", "-qO-", "http://127.0.0.1/healthz"]
      interval: 10s
      timeout: 3s
      retries: 3
    deploy: { resources: { limits: { cpus: "1.0", memory: 64M } } }
    logging: *logging
    restart: unless-stopped

  api:
    build: .
    command: ["node", "--max-old-space-size=192", "src/api.js"]
    env_file: [.env]
    environment:
      PG_POOL: "10"
    expose: ["3000"]
    depends_on:
      db: { condition: service_healthy }
      redis: { condition: service_healthy }
    healthcheck:
      test: ["CMD", "wget", "-qO-", "http://127.0.0.1:3000/readyz"]
      interval: 10s
      timeout: 3s
      retries: 3
    deploy:
      replicas: 2
      resources: { limits: { cpus: "0.5", memory: 320M } }
    logging: *logging
    restart: unless-stopped

  worker:
    build: .
    command: ["node", "--max-old-space-size=128", "src/worker.js"]
    env_file: [.env]
    environment:
      PG_POOL: "3"
    depends_on:
      db: { condition: service_healthy }
      redis: { condition: service_healthy }
    healthcheck:
      test: ["CMD-SHELL", "pgrep -f src/worker.js >/dev/null"]
      interval: 15s
      timeout: 3s
      retries: 3
    deploy: { resources: { limits: { cpus: "0.25", memory: 256M } } }
    logging: *logging
    restart: unless-stopped

  db:
    image: postgres:17-alpine
    env_file: [.env]
    command: [postgres,
      -c, shared_buffers=512MB, -c, effective_cache_size=1536MB,
      -c, work_mem=8MB, -c, maintenance_work_mem=128MB,
      -c, max_connections=50, -c, max_wal_size=1GB,
      -c, shared_preload_libraries=pg_stat_statements,
      -c, log_min_duration_statement=250, -c, track_io_timing=on]
    volumes: ["pgdata:/var/lib/postgresql/data"]
    # no "ports": reachable only from the compose network
    shm_size: 256m
    healthcheck:
      test: ["CMD-SHELL", "pg_isready -U $$POSTGRES_USER -d $$POSTGRES_DB"]
      interval: 10s
      timeout: 3s
      retries: 5
    deploy: { resources: { limits: { cpus: "1.5", memory: 2G } } }
    logging: *logging
    restart: unless-stopped

  redis:
    image: redis:7-alpine
    env_file: [.env]
    command: ["sh", "-c", "exec redis-server --requirepass \"$$REDIS_PASSWORD\" --maxmemory 128mb --maxmemory-policy noeviction --appendonly yes"]
    volumes: ["redisdata:/data"]
    healthcheck:
      test: ["CMD-SHELL", "REDISCLI_AUTH=\"$$REDIS_PASSWORD\" redis-cli ping | grep -q PONG"]
      interval: 10s
      timeout: 3s
      retries: 5
    deploy: { resources: { limits: { cpus: "0.25", memory: 256M } } }
    logging: *logging
    restart: unless-stopped

volumes:
  pgdata:
  redisdata:
Dockerfile
FROM node:22-alpine
WORKDIR /app
COPY package.json ./
RUN npm install --omit=dev --no-audit --no-fund
COPY src ./src
USER node
Dockerfile.proxy
FROM nginx:1.27-alpine
COPY nginx.conf /etc/nginx/nginx.conf
nginx.conf
worker_processes 1;
events { worker_connections 1024; }
http {
  access_log off;
  # resolved once at start: restart the proxy if the api containers get new addresses
  upstream api {
    server api:3000;
    keepalive 32;   # reuse upstream connections instead of one TCP connect per request
  }
  server {
    listen 80;
    location = /healthz { return 200 "ok\n"; }
    location / {
      proxy_pass http://api;
      proxy_http_version 1.1;
      proxy_set_header Connection "";
      proxy_set_header Host $host;
      proxy_read_timeout 10s;
    }
  }
}
package.json
{
  "name": "saas-sizing-example",
  "private": true,
  "type": "module",
  "dependencies": {
    "ioredis": "5.4.1",
    "pg": "8.13.1"
  }
}
src/db.js
import pg from 'pg'
import Redis from 'ioredis'

// pool size x processes must stay under Postgres max_connections (see the budget table)
export const pool = new pg.Pool({
  connectionString: process.env.DATABASE_URL,
  max: Number(process.env.PG_POOL || 10),
  statement_timeout: 5000,
})
export const redis = new Redis(process.env.REDIS_URL, { maxRetriesPerRequest: 2 })
src/api.js
import http from 'node:http'
import { pool, redis } from './db.js'

const json = (res, code, body) => {
  res.writeHead(code, { 'content-type': 'application/json' })
  res.end(JSON.stringify(body))
}
const readBody = req => new Promise((ok, fail) => {
  let s = ''
  req.on('data', c => { s += c; if (s.length > 4096) req.destroy() })
  req.on('end', () => ok(s))
  req.on('error', fail)
})

const routes = {
  'GET /healthz': (req, res) => json(res, 200, { ok: true }),
  // readiness touches both stores; the container healthcheck uses it
  'GET /readyz': async (req, res) => {
    await pool.query('select 1')
    await redis.ping()
    json(res, 200, { ok: true })
  },
  'GET /api/tasks': async (req, res, url) => {
    const account = Number(url.searchParams.get('account'))
    if (!Number.isInteger(account) || account < 1) return json(res, 400, { error: 'account' })
    const { rows } = await pool.query(
      'select id, title, status from tasks where account_id = $1 order by id desc limit 20', [account])
    json(res, 200, rows)
  },
  'GET /api/report': async (req, res, url) => {
    const account = Number(url.searchParams.get('account'))
    if (!Number.isInteger(account) || account < 1) return json(res, 400, { error: 'account' })
    const { rows } = await pool.query(
      'select status, count(*)::int as n from tasks where account_id = $1 group by status', [account])
    json(res, 200, rows)
  },
  'POST /api/tasks': async (req, res) => {
    let b
    try { b = JSON.parse(await readBody(req)) } catch { return json(res, 400, { error: 'json' }) }
    const account = Number(b.account)
    if (!Number.isInteger(account) || account < 1 || typeof b.title !== 'string' || b.title.length > 200) {
      return json(res, 400, { error: 'input' })
    }
    const { rows } = await pool.query(
      "insert into tasks (account_id, title) values ($1, $2) returning id", [account, b.title])
    await redis.lpush('jobs', String(rows[0].id))
    json(res, 201, { id: rows[0].id })
  },
}

const server = http.createServer(async (req, res) => {
  const url = new URL(req.url, 'http://x')
  const h = routes[`${req.method} ${url.pathname}`]
  if (!h) return json(res, 404, { error: 'not found' })
  try { await h(req, res, url) } catch (e) {
    console.error(e.message)
    json(res, 503, { error: 'unavailable' })
  }
})
server.listen(3000, () => console.log('api up'))

// compose sends SIGTERM on stop: finish in-flight requests, then close the stores
process.on('SIGTERM', () => server.close(async () => { await pool.end(); redis.disconnect(); process.exit(0) }))
src/worker.js
import { createHash } from 'node:crypto'
import { pool, redis } from './db.js'

let stop = false
process.on('SIGTERM', () => { stop = true })

// stands in for real background work (mail, PDF, webhook): a little CPU, then one UPDATE
const work = title => {
  let h = title
  for (let i = 0; i < 2000; i++) h = createHash('sha256').update(h).digest('hex')
  return h.slice(0, 16)
}

console.log('worker up')
while (!stop) {
  const r = await redis.brpop('jobs', 2)
  if (!r) continue
  const id = Number(r[1])
  const { rows } = await pool.query('select title from tasks where id = $1', [id])
  if (!rows.length) continue
  await pool.query("update tasks set status = 'done', result = $2 where id = $1", [id, work(rows[0].title)])
}
await pool.end()
redis.disconnect()
init.sql
create extension if not exists pg_stat_statements;
create table tasks (
  id bigserial primary key,
  account_id int not null,
  title text not null,
  status text not null default 'open',
  result text,
  created_at timestamptz not null default now()
);
create index tasks_account_id_idx on tasks (account_id, id desc);
seed.sql
-- 1,000,000 tasks for 2,000 accounts (about 500 each), 70% done
insert into tasks (account_id, title, status)
select 1 + (g % 2000), 'task ' || g, case when g % 10 < 7 then 'done' else 'open' end
from generate_series(1, 1000000) g;
analyze tasks;
make-env.sh
#!/bin/sh
# writes .env with random secrets; never commit it, and never reuse these values elsewhere
set -eu
[ -e .env ] && { echo ".env exists, not overwriting"; exit 1; }
PG=$(openssl rand -hex 24)
RD=$(openssl rand -hex 24)
umask 077
cat > .env <<EOF
POSTGRES_USER=app
POSTGRES_PASSWORD=$PG
POSTGRES_DB=app
REDIS_PASSWORD=$RD
DATABASE_URL=postgres://app:$PG@db:5432/app
REDIS_URL=redis://:$RD@redis:6379
EOF
k6.js
import http from 'k6/http'
import { check } from 'k6'

const BASE = __ENV.BASE || 'http://proxy'
const RATE = Number(__ENV.RATE || 100)

// open model: requests arrive at RATE per second whether or not the server keeps up,
// which is how real users behave (closed-loop VUs hide overload)
export const options = {
  scenarios: {
    mixed: {
      executor: 'constant-arrival-rate',
      rate: RATE,
      timeUnit: '1s',
      duration: __ENV.DURATION || '30s',
      preAllocatedVUs: 50,
      maxVUs: 500,
    },
  },
  thresholds: {
    http_req_failed: ['rate<0.01'],
    http_req_duration: ['p(95)<300'],
  },
  summaryTrendStats: ['avg', 'med', 'p(90)', 'p(95)', 'p(99)', 'max'],
}

export default function () {
  const account = 1 + Math.floor(Math.random() * 2000)
  const r = Math.random()
  let res
  if (r < 0.80) res = http.get(`${BASE}/api/tasks?account=${account}`)
  else if (r < 0.90) res = http.get(`${BASE}/api/report?account=${account}`)
  else res = http.post(`${BASE}/api/tasks`, JSON.stringify({ account, title: 'k6 task' }),
    { headers: { 'content-type': 'application/json' } })
  check(res, { 'status 200/201': x => x.status === 200 || x.status === 201 })
}
bench.sh
#!/bin/sh
# usage: ./bench.sh 200 500 1000   (requests per second, one 40 s step each)
set -eu
NET=$(docker compose ps -q proxy | xargs docker inspect --format '{{range $k, $v := .NetworkSettings.Networks}}{{$k}}{{end}}')
for RATE in "$@"; do
  echo "=== ${RATE} req/s"
  # mid-run snapshot of container CPU / memory and host CPU steal ("st") and swap ("si so")
  ( sleep 20; docker stats --no-stream --format '{{.Name}} cpu={{.CPUPerc}} mem={{.MemUsage}}' $(docker compose ps -q); vmstat 5 2 | tail -1 ) &
  docker run --rm -i --network "$NET" -e RATE="$RATE" -e DURATION=40s \
    grafana/k6 run --quiet - < k6.js 2>&1 | grep -E 'http_req_duration\.|http_req_failed\.|http_reqs|dropped_iterations|vus_max'
  wait
done
sh make-env.sh
docker compose up -d --build
docker compose exec -T db sh -c 'psql -v ON_ERROR_STOP=1 -q -U $POSTGRES_USER -d $POSTGRES_DB' < init.sql
docker compose exec -T db sh -c 'psql -v ON_ERROR_STOP=1 -q -U $POSTGRES_USER -d $POSTGRES_DB' < seed.sql
curl -s http://127.0.0.1:8080/readyz
./bench.sh 500 1000
docker compose down -v
I tuoi numeri saranno diversi. Quando lo sono, fidati dei tuoi e non dei nostri, poi configura un server cloud per la tua app oppure scrivi a sales@dcxv.com.