FastFlowIPs
How It All Started
Open-source or not open-source - that is the question.
The eternal dilemma between grab something off the shelf and build your own has only gotten sharper in the age of endless AI tools. But should you actually write something yourself. There's no universal answer. However, if you dump your fears into /dev/null, the idea doesn't seem so crazy anymore.
Our story began with an upgrade of VyOS on production routers to 1.5.x (circinus).
After this already nerve-wracking process, we discovered that part of our firewall rules had quietly self-deleted. And the fun part - it was the same specific part on every router.
So we reluctantly opened VyOS Project Updates, where we stumbled upon this: FastNetMon-based service ids ddos-protection is removed from rolling and deprecated in LTS releases (T7241):
For quite a while, we had a CLI for configuring FastNetMon - a DDoS detection daemon. However, that integration was never especially deep, and we do not see a path to significant improvement.
The long-term plan is to move FastNetMon to an addon, once we finalize a mechanism for allowing addons to extend the system CLI. As for built-in components, the approach will be "quality over quantity" - it's better to have a smaller number of integrations that serve a large number of users and play well together, but to provide an option for everyone to install or develop integrations for their own needs.
The issue wasn't extremely urgent or critical, but as an IPv4 broker and hosting provider, we needed such monitoring. Therefore, we decided to act immediately.
After going through the typical cycle - denial, anger, bargaining - we finally accepted the loss of service ids ddos-protection and tried resurrecting FastNetMon Community manually. That's when depression kicked in. The Community version refused to install for reasons that, let's be honest, everyone already suspected. And no one was in a hurry to buy the commercial version.
The issue wasn't catastrophic, but for us an IPv4 broker and hosting provider such monitoring was essential. So the decision was clear: act immediately.
FastNetMon: We Love You, But...
Our relationship with FastNetMon started not too long ago, but the tool quickly won our hearts and delivered real value - even though it consistently chewed through about 30% of our CPU.
Traffic visibility was perfect, Grafana was glowing with metrics, and life felt just a little more peaceful.
And now? Now we're staring at empty traffic dashboards and, for some reason, voluntarily choosing the "make life harder" route. Well... not voluntarily. More like by force. And as usual, you only start remembering all the flaws once you lose something.
FastNetMon generally lived up to our expectations - and even exceeded them.
But for all its benefits, it collected a massive pile of absolutely unnecessary data, turning dashboards into a noisy carnival of numbers and graphs. And then there was that CPU load not catastrophic, but annoying enough. So we never formed a firm "yes" or "no." The soul was craving simplicity and lightness, not yet another subscription and fine-tuning every time the tool sneezed.
The idea to build our own tool didn't come instantly. The battle for FastNetMon continued - we even tried reviving it by pulling an old binary from another server. Yes, it was a bit of a questionable approach, but it worked: FastNetMon came back to life. Except... there was no joy in it.
It felt like we had stitched together a taxidermy version of a long-gone pet: technically standing, vaguely recognizable, but living with it felt... unsettling.
So we collectively agreed: this cannot continue. And that's when we started building our own monitoring-powered DDoS protector with blackjack and minimal CPU load.
And Then Things Escalated
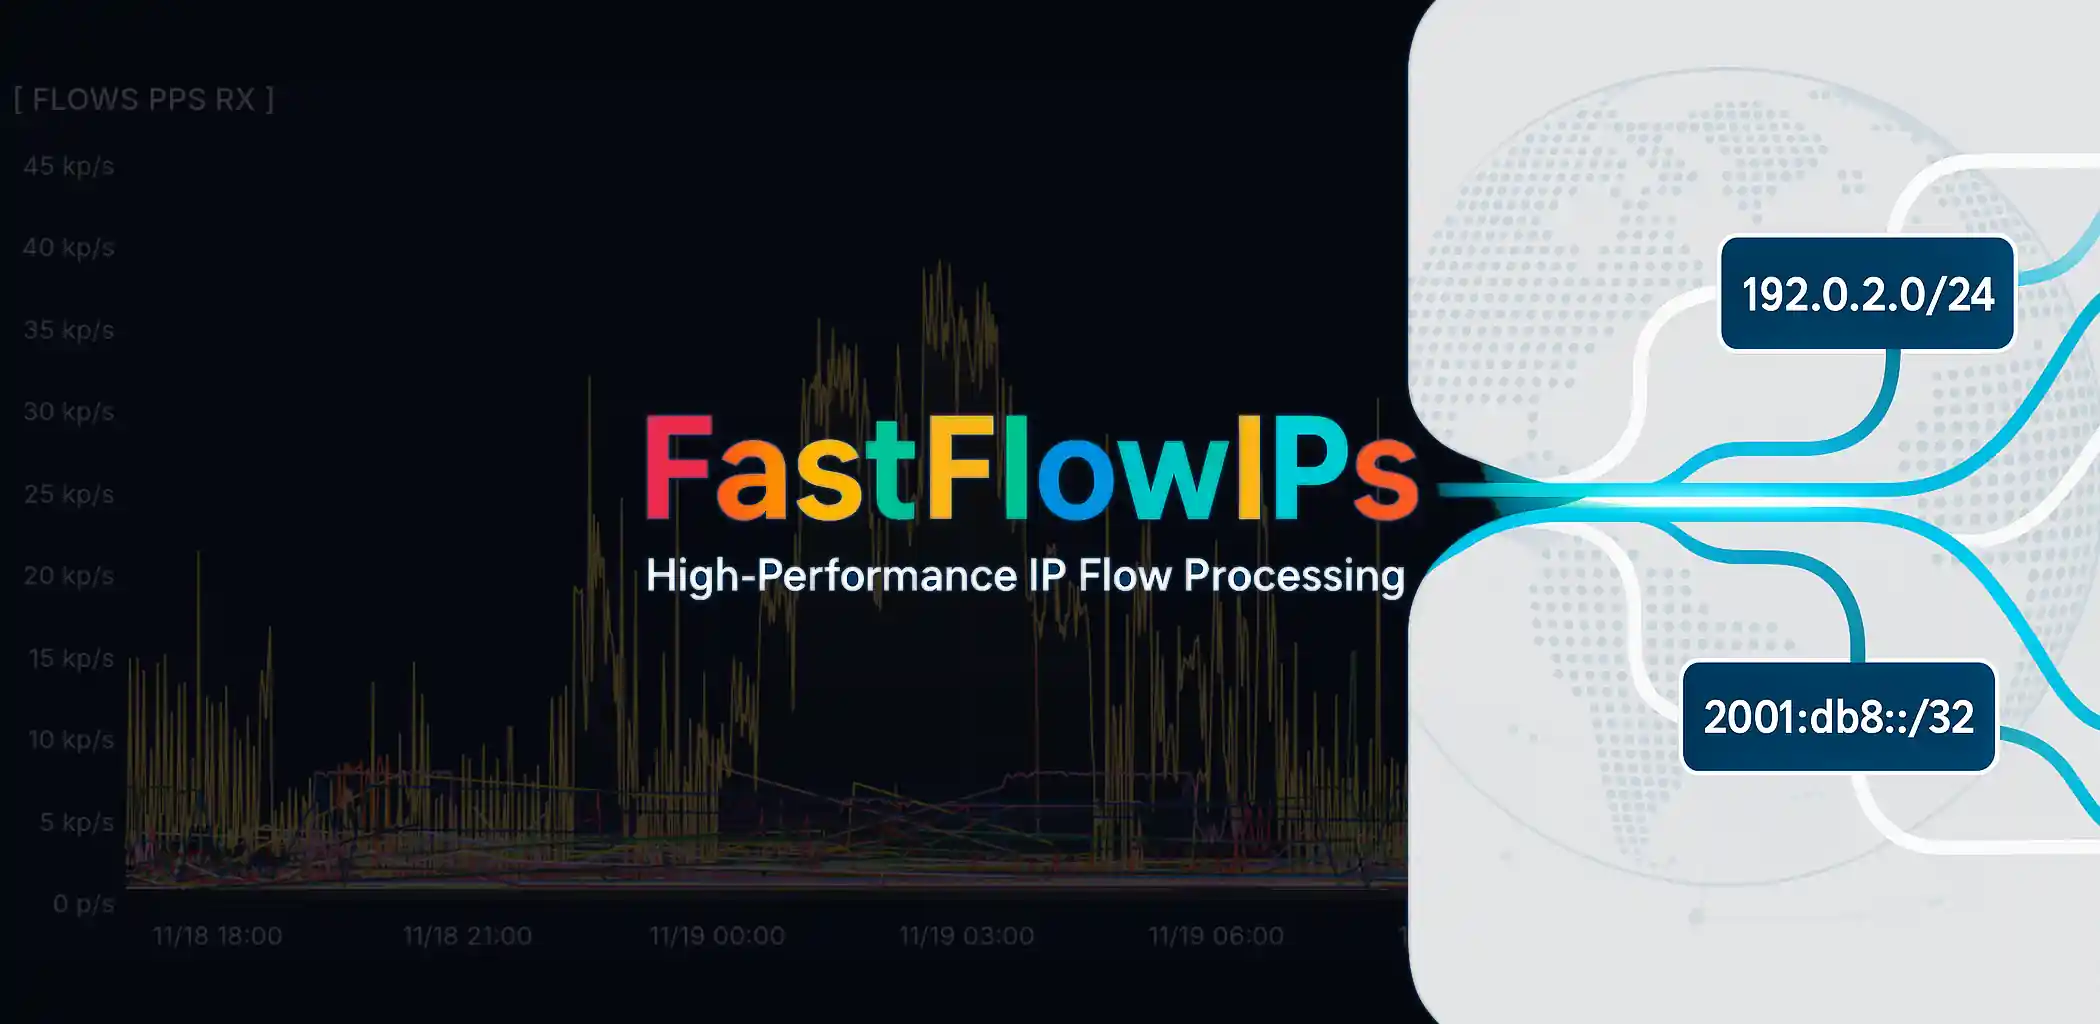
So the development of our own tool began. The brightest minds of the team plus a couple of AI models, of course joined the brainstorming session, and that's how FastFlowIPs. FastFlowIPs is a high-performance eBPF-based network monitoring tool that tracks per-IP traffic statistics in real time. It was designed for production environments with minimal overhead.
The core idea is simple: it captures network traffic via eBPF, calculates per-IP statistics (PPS, Mbps), and can automatically block IP addresses that exceed configurable thresholds. Metrics are exported via the Graphite protocol and match beautifully with Grafana's expectations. The resulting dashboards are clean, lightweight, and quick to set up.
FastFlowIPs runs with a single one-liner where you specify -min-ips-pps and -min-flow-pps to export only the most meaningful metrics, plus the network and interface to monitor. The only must-have requirement is explicitly setting -graphite-host and -graphite-port if you want to ship metrics.
On top of that, FastFlowIPs is optimized for high-load networks:
75% fewer mutex operations, 60% faster string handling compared to typical implementations.
An example configuration is shown below:
# Interface and basics
-interface eth0              # Network interface (default: eth0)
-interval 5s                 # Collection interval
-show-stats                  # Display periodic tables
-verbose                     # Detailed logging

# Network filtering
-networks "192.168.1.0/24"   # Monitor specific networks only

# IP banning thresholds
-ban-pps-rx 1000             # Ban if receiving > 1000 PPS
-ban-pps-tx 500              # Ban if sending > 500 PPS
-ban-mbps-rx 100             # Ban if receiving > 100 Mbps
-ban-mbps-tx 50              # Ban if sending > 50 Mbps
-ban-time 5m                 # How long to ban
-ban-script /path/script.sh  # Script to execute on ban/unban

# Graphite export
-graphite-host localhost     # Graphite server
-graphite-port 32003         # Graphite port
-min-flow-pps 10             # Only export flows > 10 PPS
-min-ips-pps 5               # Only export IPs > 5 PPS
There was no way we could skip Monitoring Modes they let you tune this modest little tool to your personal taste:
- Silent mode (default): shows only ban events and startup messages. Perfect for production.
- Stats mode (-show-stats): prints periodic traffic tables, sorted by volume.
- Verbose mode (-verbose): detailed logging, including Graphite export statistics.
And the cherry on top - the ban script, which ruthlessly blocks any suspicious activity that crosses the defined thresholds:
/path/to/script.sh ban 192.168.1.100    # IP exceeded threshold
/path/to/script.sh unban 192.168.1.100  # Ban expired
A simple example using iptables:
#!/bin/bash
case $1 in
  ban)   iptables -I INPUT -s $2 -j DROP ;;
  unban) iptables -D INPUT -s $2 -j DROP 2>/dev/null ;;
esac
But in any case, you can always adjust the script and make it more or less aggressive - whatever your infrastructure requires.
And a few words about Graphite and metrics. A Grafana dashboard can be built in just a few minutes using two core metric types:
Flow metrics: **network.flows.{SRC_IP}*to*{DST_IP}.{pps,mbps}.{rx,tx}**
IP metrics: **network.ips.{IP_ADDRESS}.{pps,mbps}.{rx,tx}**
You can find more details about FastFlowIPs in the repository itself: https://github.com/denisix/fastflowips and you can always support the author or contribute to the evolution of this small but already mighty tool.
Architecture in 3 Paragraphs (Without the Suffering)
If we describe the tool in human language, inside it's a neat little Go service that listens to NetFlow packets, parses them into components, and builds simple per-IP statistics: pps, mbps, inbound/outbound - basically, who's making noise in the network and why. All the math is done on the fly - Go is perfect for lightweight but high-throughput operations like this.
The data is aggregated into small in-memory structures, sorted, and periodically sent outward: either to Graphite/Grafana, or to any other sink you specify. IP blocking via an external script is implemented through PPS/Mbps thresholds and a call to BanScript - just in case someone suddenly decides to host a small local DDoS festival.
The best part: it's a single clean binary with no pile of dependencies and without the usual "open-source small business hell." Configs are passed through flags, stats are collected directly, the logic is transparent. In the end, we got a lightweight and honest tool that does exactly what we need - no excessive magic, no heavy demons attached.
Results After a Couple of Days
The debugging process turned out to be much longer and more complicated than writing the tool itself. Initially, we didn't even plan to set threshold values for FastFlowIPs, so several times (many) Grafana nervously held its breath under the sheer volume of metrics and refused to show them to us at all. The dashboard legend contained so many IP addresses that you could scroll it for hours and still probably never reach the end. We miscalculated - but where?
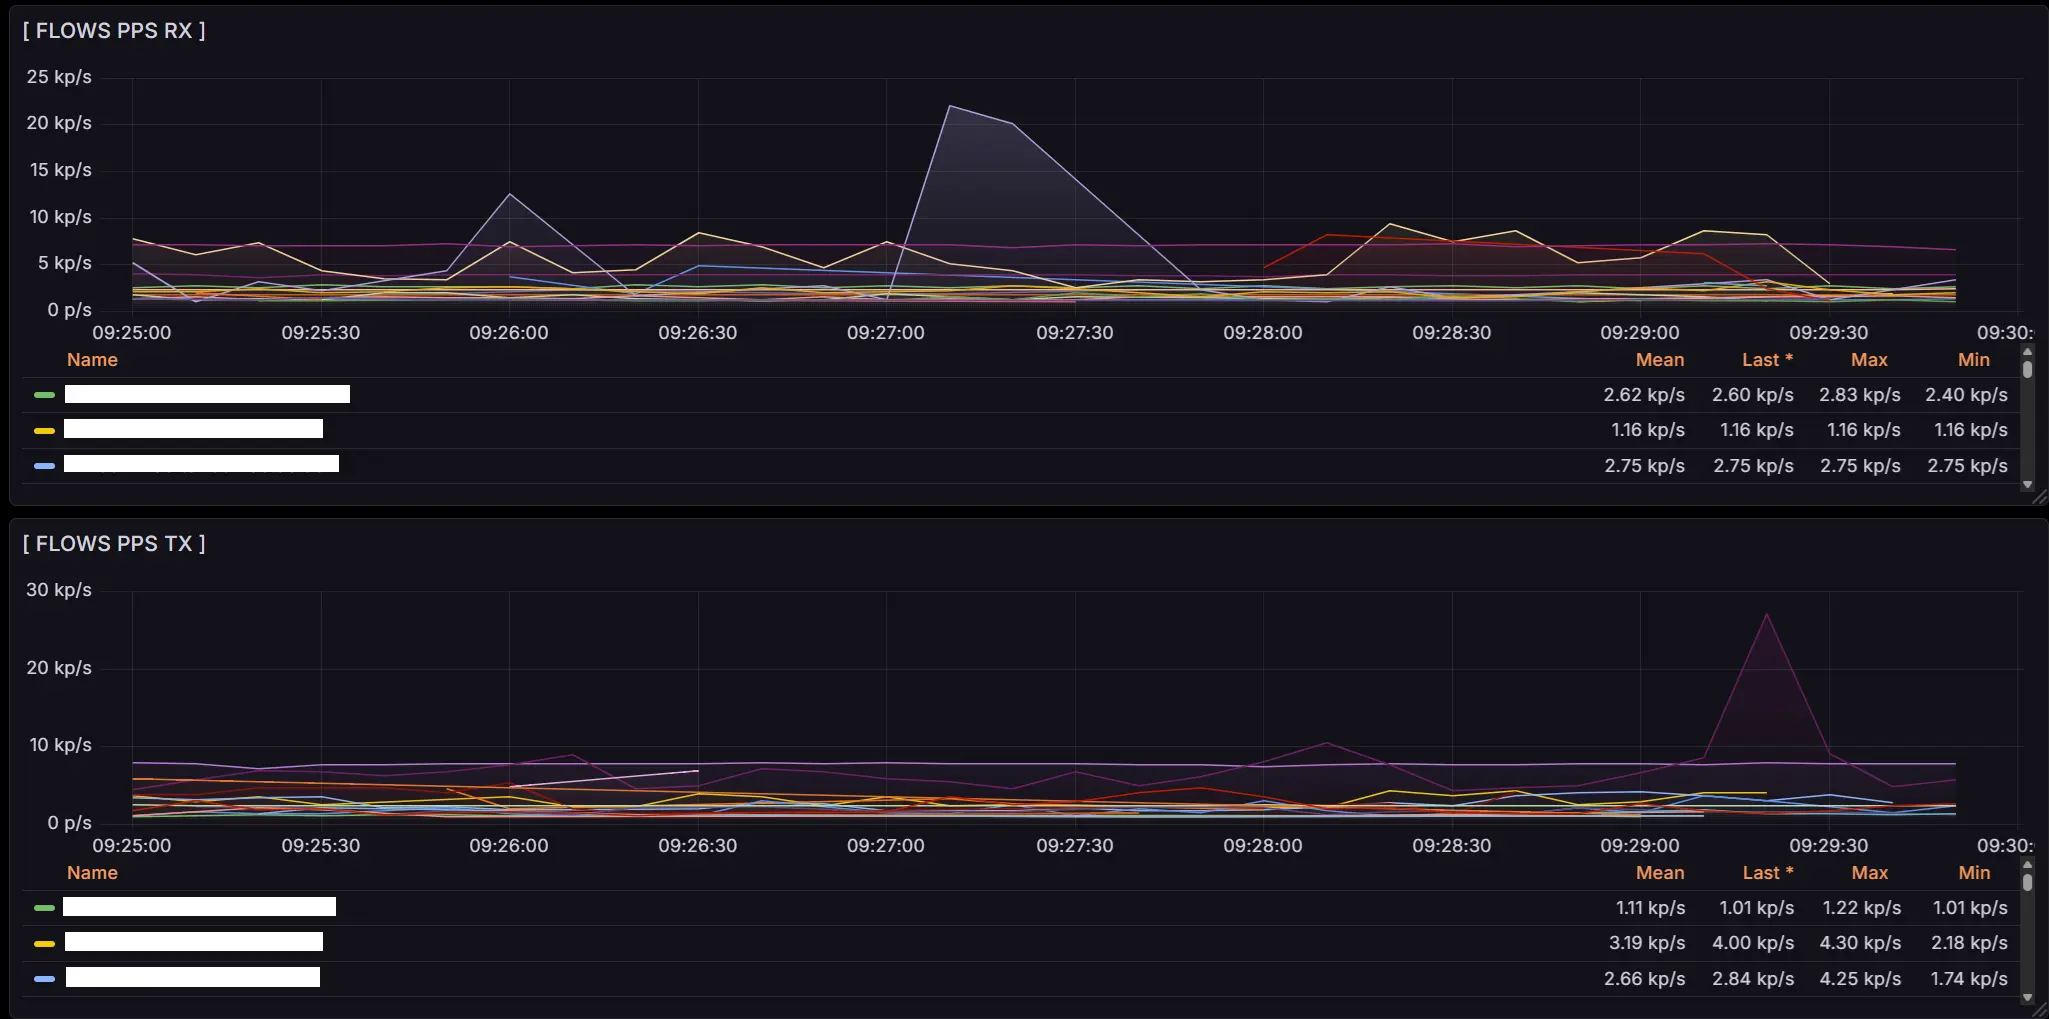
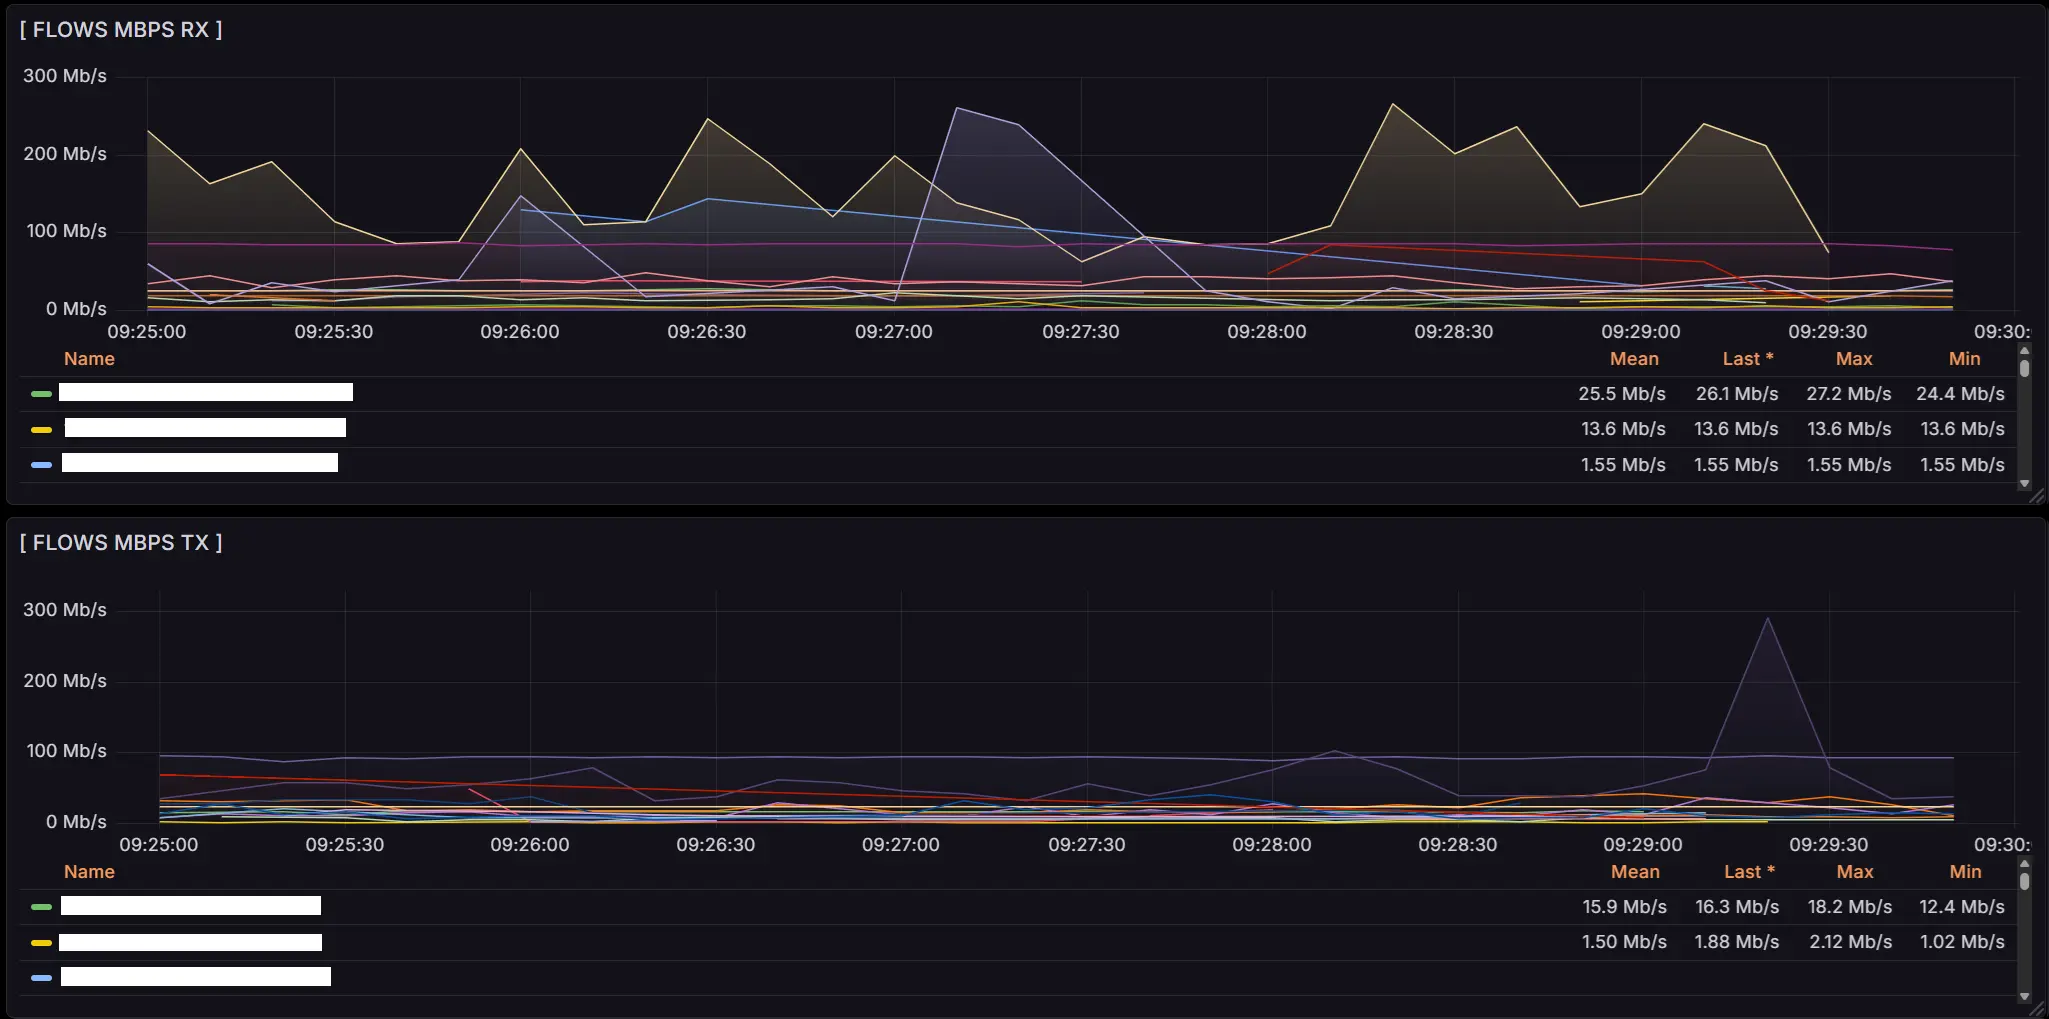
Debugging kept breaking things, then stabilizing them, then breaking our exhausted FastFlowIPs again, until it started quietly crying in corner-case scenarios. There were either too many metrics, or too few, or none at all. Apparently from emotional overload. On top of that, the biggest mystery for us turned out to be the Flows RX/TX metrics, which got slightly swapped, something that was beautifully visible in real time on VyOS routers. The greatest minds of our team wrestled with this, and eventually the goal was reached: the metrics were stabilized, and Grafana was cured of its asthma.
Today, we have neat, tidy, and informative metrics that show exactly the network traffic we need:


When it's time to build your own mini-FastNetMon
Building your own bikes is bad. Until the moment comes when you simply can't move forward without one.
Writing your own tool absolutely makes sense when the existing solutions are either too heavy or too smart for your specific task. When you don't need 100500 features, integrations with a space station, and dashboards across 19 monitors - when you just need numbers, quickly and without migraines.
You should also consider rolling your own solution if the situation demands flexibility: you need to add a metric on the fly, embed custom anti-DDoS logic, make the monitoring play nicely with your quirky hardware, or simply bypass limitations that were suddenly removed from your favorite firmware (a warm hello to VyOS 1.5).
In short, building your own tool is about control, speed, minimalism, and not depending on components that suddenly vanish from repositories. The main thing is to remember the golden rule: if it can be done simpler - do it simpler.
And one more rule: if it works - don't touch it.
The Grand Finale
In the end, this whole story isn't about traffic, DDoS, or even FastNetMon.
It's about the fact that sometimes a team simply wants a tool that works, doesn't break after an update, and doesn't turn your life into a rerun of The Shawshank Redemption.
We didn't reinvent the bicycle - we built our own tiny scooter that fits our road perfectly. And there's nothing wrong with that. In a world where massive open-source projects live their own unpredictable lives, it's nice to have something of your own - familiar, stable, and wonderfully boring.
So if you've ever looked at yet another "perfect but a little too perfect" tool and thought, "honestly, it'd be easier to write it myself" - you might actually be on the right path.
Just do it smartly, with tests... and be ready to suffer a little.